Geopolitical Shockwaves: How Middle East Conflict Redraws the Market Map
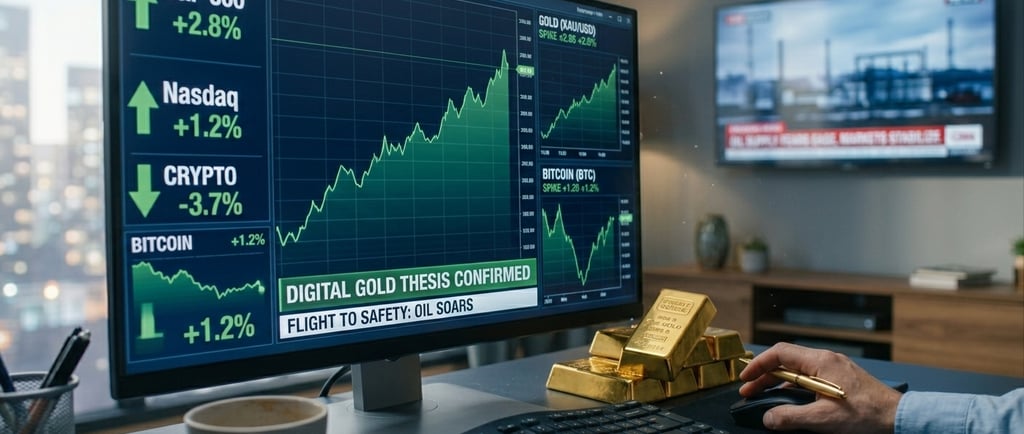
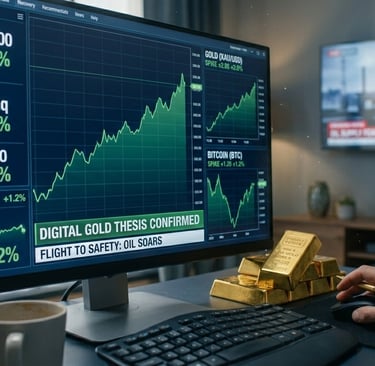
Geopolitical conflict where investors sell volatile stocks and crypto in favor of defense equities, gold, and the $USD
Salamon and Salamon
3/2/20263 min read
Executive Summary In the complex world of high-stakes trading, the Middle East functions as a global "volatility engine." When regional tensions escalate into kinetic strikes, the repercussions across Wall Street and digital asset exchanges are nearly instantaneous. For the modern investor, these events are not merely headlines; they are critical catalysts that reprice risk in real-time. This report analyzes how geopolitical shocks propagate through financial markets, the predictable three-phase reaction function observed in historical data, and the strategic implications for asset allocation. As the administration navigates a period of heightened energy insecurity and inflation, understanding the "geopolitical risk premium" is no longer optional—it is a core requirement for portfolio preservation.
Introduction: The Anatomy of a Geopolitical Shock
Geopolitical risk is an inherent, albeit unpredictable, feature of global investing. While markets are generally adept at absorbing information, conflicts in resource-rich regions like the Middle East present a unique challenge. Because the region is a primary global "gas station"—facilitating roughly 20% of global oil volumes through the Strait of Hormuz—any threat to this chokepoint transcends regional borders to become a systemic economic risk. When the narrative shifts from diplomacy to military engagement, the financial ecosystem reacts by pricing in a "risk premium" that ripples through energy, equities, currencies, and even emerging asset classes like Bitcoin.
The Traditional Pivot: Flight to Quality
When uncertainty hits, the "smart money" typically adheres to a well-established script known as the "Flight to Quality." This behavior is driven by a collective desire to shed speculative risk in favor of assets that provide stability during periods of acute tension.
Aerospace and Defense: Defense stocks often decouple from the broader market. When the S&P 500 retracts due to fear, companies providing tactical technology and national security infrastructure frequently see a surge in valuation, reflecting investor expectations of increased government procurement during prolonged conflicts.
Energy as a Functional Tax: Given the region's centrality to global energy, any disruption to maritime supply chains acts as an immediate tax on the consumer. Elevated prices at the pump—often exceeding $4.00 per gallon—reduce disposable income, creating a drag on broader consumer spending.
The Gold Anchor: Gold remains the ultimate safe haven. Historically, during the initial 48 hours of a conflict, gold prices exhibit an upward bias, climbing between $40.00 and $80.00 per ounce as investors hedge against fiat currency instability and the potential for prolonged inflation.
Digital Assets: The "Risk-On" Reality Check
The "Digital Gold" thesis for Bitcoin faces its most rigorous stress tests during active warfare. While proponents argue that decentralized assets should act as a hedge, the short-term reality is often more volatile.
Liquidity and Margin Calls: In the immediate aftermath of a shock, Bitcoin often experiences a "flash crash." This is frequently attributed to global traders selling their most liquid, 24/7 assets to satisfy margin calls in their traditional stock portfolios.
The Resilience Factor: Historically, Bitcoin has demonstrated a "V-shaped" recovery trajectory, often bouncing back faster than traditional equities as the initial panic subsides and the asset’s relative scarcity becomes a focus again.
Stablecoin Migration: During periods of heightened volatility, investors frequently rotate capital into dollar-pegged stablecoins. This allows them to "park" wealth in a digital-dollar environment, insulating their portfolio from market swings while remaining ready to re-enter positions once the turbulence stabilizes.
Dissecting the Market’s Reaction Function
Market response to a "Geopolitical Shock Event" typically follows a distinct three-phase pattern:
Phase A: The Panic (Hours 0-12): Equities typically retract by 1.5% to 3%, while Crude Oil often spikes by $3.00 to $7.00 per barrel. This is an algorithmic and emotional reaction where speed is favored over fundamental analysis.
Phase B: The Digestion (Days 1-3): The market begins to differentiate between a "localized skirmish" and a "regional war." During this phase, we see a mean reversion in some assets; Bitcoin often returns to pre-strike levels, even if equity markets remain sluggish.
Phase C: The New Normal (Weeks 1+): The focus shifts to the Federal Reserve and inflation. If oil remains elevated, it fuels systemic inflation, forcing investors to price in a "Higher for Longer" interest rate environment, which can cap the upside for tech-heavy equity indices.
Strategic Conclusion: Navigating the Probabilities
Investing during a conflict is not about predicting the future; it is about playing the odds. Historical data suggests three primary probability clusters:
Controlled Escalation (65% Probability): High volatility followed by a return to macro fundamentals. In this scenario, the "dip" is historically a buying opportunity.
Energy Supply Disruption (25% Probability): A major closure of a shipping lane triggers a bear market, making Gold and defensive stocks the primary winners.
De-escalation (10% Probability): A diplomatic breakthrough leads to a "Relief Rally," where those positioned defensively may miss a 5% to 10% jump in risk assets.
Ultimately, the goal is not to be right about the war, but to be prepared for the market’s response. Diversification remains the only "free lunch" in an era of geopolitical uncertainty.
Bibliography
Allianz Global Investors. Four signals to track as geopolitical risk rises. (2026).
CFA Institute. Geopolitical Shocks: What Moves First. (2026).
International Monetary Fund (IMF). How the War in the Middle East Is Affecting Energy, Trade, and Finance. (2026).
J.P. Morgan Research. US–Israel Military Operation Against Iran: Are Markets on Edge? (2026).
Trading Economics. Gold Price Historical Data & Inflation Impact Analysis. (2026).
Contact
Newsletter
contact@economicfinanceworldwide.com
Fone: +55 54 991220659
© 2026. All rights reserved. https://economicfinanceworldwide.com/privacy-policy