GOLD, SILVER, AND COPPER IN 2026: PASSING CORRECTION OR THE START OF A NEW PHASE IN THE METALS MARKET?
Macrostructural Commodity Analysis
INVESTIMENT
By Marcelo Salamon
7/5/20269 min read
EXECUTIVE SUMMARY
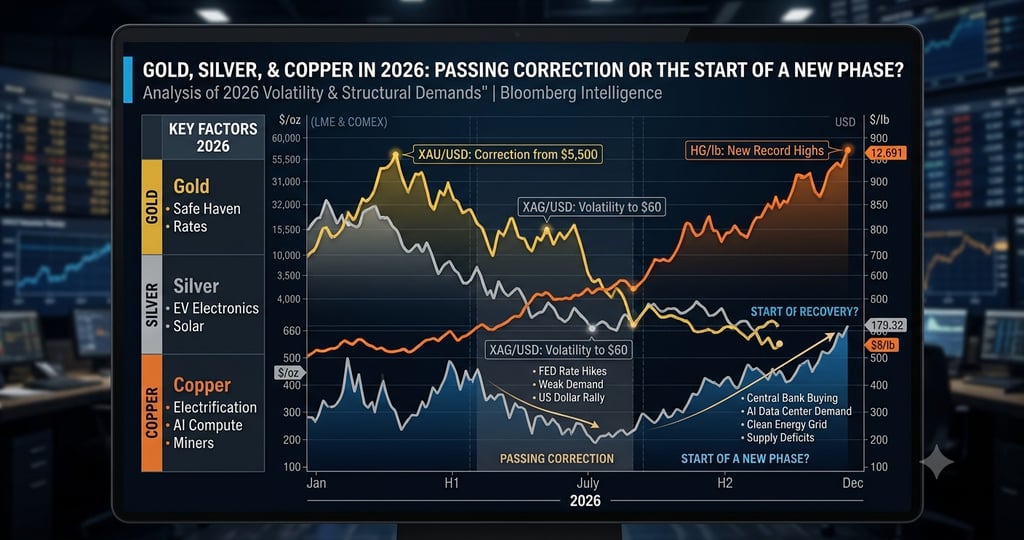
This technical report analyzes the profound volatility that impacted the precious and industrial metals complexes during the first half of 2026. Following historic highs driven by supply shocks and global liquidity in 2025, markets are facing a structural reconfiguration imposed by the Federal Reserve's restrictive stance and a fundamental demand transformation tied to Artificial Intelligence and clean energy infrastructure. We investigate whether the recent pullback signals the exhaustion of the supercycle or a cyclical accumulation opportunity under severely tight physical fundamentals.
Keywords: Commodities, Precious Metals, Energy Transition, Federal Reserve, Artificial Intelligence.
INTRODUCTION
The first half of 2026 has established itself as one of the most volatile and complex periods in the modern history of global commodity markets. The euphoria that characterized the end of 2025, driven by severe supply chain bottlenecks, chronic geopolitical uncertainties across Eurasia and the Middle East, and an insatiable appetite for tangible assets, culminated in absolute all-time highs during the first two months of 2026. However, pricing dynamics suffered an abrupt and violent reversal starting late in the first quarter, when a sweeping technical correction inflicted double-digit losses on leveraged investors and triggered a global wave of margin liquidations.
This movement raises a pivotal question for trading desks, macro hedge funds, and corporate planners: are we witnessing the premature exhaustion of the commodity supercycle, or are we in the middle of a healthy, short-term technical correction necessary to drain speculative excesses before a structural leg higher? To answer this provocation, it is imperative to segment the market between purely monetary and financial safe-haven assets, such as gold, and those whose pricing reacts directly or hybridly to the impulses of modern industrial infrastructure and the technological frontier of Artificial Intelligence (AI), such as silver and copper.
The following analysis details the macroeconomic catalysts behind the recent price pullback, dissects the physical supply and demand anatomy of each metal, lays out the institutional consensus of Wall Street’s leading research houses (Goldman Sachs, JP Morgan, UBS, Citigroup, and ING), and projects the baseline and alternative scenarios for the remainder of 2026 and into the strategic horizon of 2027.
GOLD: FROM MONETARY EUPHORIA TO THE REALITY OF HIGH INTEREST RATES
Gold entered 2026 trading under powerful technical momentum. In late January, front-month troy ounce futures breached the psychological and historical barrier of $5,500 on the New York Mercantile Exchange (COMEX), sustained by continuous inflationary hedging flows and the market perception that global interest rates had carved a definitive cyclical peak. However, the second quarter administered a harsh reality check to investors. The precious metal experienced one of its deepest and fastest quarterly pullbacks since the 2013 crash, retreating to the $4,000 to $4,200 range by mid-July, representing a year-to-date contraction of approximately 7%.
The fundamental mechanism driving this retrenchment is intimately tied to the aggressive repricing of the U.S. Treasury yield curve. Under the new leadership of Kevin Warsh at the Federal Reserve, the Federal Open Market Committee (FOMC) adopted a markedly hawkish tone, dismantling previous institutional expectations for rapid, deep cuts to short-term benchmark rates. With the U.S. labor market demonstrating unforeseen resilience and core inflation prints tracking persistently above the 2% target, the hawkish faction of the Fed gained significant traction, signaling a readiness to execute additional rate hikes should the disinflationary process stall. This shift sparked a major rally in 10-year real yields (US10Y), drastically elevating the opportunity cost of holding non-yielding real assets, undermining gold's tactical appeal, and strengthening the U.S. Dollar Index (DXY) against a basket of global currencies.
Despite fierce selling pressure across New York and London derivatives markets, the physical gold market encountered a robust line of defense that prevented a structural collapse in prices: uninterrupted institutional buying by global central banks. The World Gold Council (WGC) confirmed that while specific institutions, such as the Central Bank of Turkey, executed tactical liquidations to support domestic currency liquidity, net official global purchases remain historically elevated in 2026. The structural momentum remains centered on the Central Bank of Poland and, fundamentally, the People’s Bank of China (PBOC), which extended its consecutive monthly gold reserve accumulation streak to nineteen months.
The WGC’s latest sovereign survey indicates that roughly 80% of emerging market reserve managers plan to expand their gold allocations over the next twelve months. This behavior reflects an ongoing push to diversify reserve assets away from the strictly U.S. dollar-based settlement system, providing an incredibly rigid technical floor for the metal in the $4,000 region. The Wall Street consensus indicates that the current movement constitutes a classic cyclical correction rather than a structural trend reversal. While ING adopts a more conservative stance, forecasting stabilization near $4,300 due to higher-for-longer interest rates, JP Morgan maintains an aggressive year-end target of $6,000 per ounce, assuming that cracks in the corporate credit market will eventually force the Fed to pivot in the second half of the year.
SILVER: THE MOST VIOLENT COLLAPSE, BUT THE FASTEST RECOVERY
While the gold market's dynamics resembled a controlled, orderly descent, silver's behavior in the first half of 2026 was defined by extreme volatility and severe liquidity stress. Following an extraordinary rally of more than 140% throughout 2025—fueled by a massive, systematic short squeeze—silver surged past the $120 per ounce threshold in January 2026. The subsequent retracement, however, was merciless: the metal plunged over 40% from its peak, momentarily breaking below key technical support at $60 during the final weeks of June.
A forensic analysis of this market's microstructure reveals three distinct catalysts for the collapse. First, the CME Group, acting to mitigate systemic default risks, hiked maintenance margin requirements for silver futures contracts on multiple consecutive occasions. This triggered wave after wave of forced margin calls, compelling quantitative hedge funds and highly leveraged commodity trading advisors (CTAs) to liquidate long positions at any price to mitigate further drawdown. Second, the broad-based surge in the U.S. dollar heavily penalized speculative flows allocated to the precious metals complex. Third, the sheer scale of the gains generated in 2025 made silver the primary target for institutional profit-taking to rebalance multi-asset portfolios.
Despite the violence of the selloff, the market opened the first days of July displaying a rapid technical recovery, consolidating spot and futures volume in the $60 to $65 per ounce band. The underlying physical and structural fundamentals supporting the long-term bullish thesis remain not only intact but severely tightened. The global silver market is on track to record its sixth consecutive year of structural physical supply deficits. Global mine supply—heavily concentrated in Mexico, Peru, and China—remains stagnant, plagued by declining ore grades at mature operations, labor disputes, and escalating capital expenditure costs.
Simultaneously, industrial consumption of silver is accelerating at a geometric rate. The metal possesses the highest electrical and thermal conductivity of any known element, making it entirely irreplaceable in the manufacturing of conductive pastes and busbars for next-generation solar photovoltaic cells (TOPCon and HJT technologies), the advanced electronic architecture of high-voltage electric and hybrid vehicles (EVs), and specialized cabling and electromagnetic cooling systems for new data centers configured for high-density Artificial Intelligence processing.
COMMODITY OUTLOOK & INSTITUTIONAL CONSENSUS (ITEMIZED SUMMARY)
Gold (XAU/oz)
Current Price (July 2026): $4,120.50
Conservative Year-End Forecast: $4,300 (ING)
Optimistic Year-End Forecast: $6,000 (JP Morgan)
Wall Street Consensus (Average): $5,200
Primary Demand Driver: Central Bank Reserves and Macroeconomic Risk Mitigation
Silver (XAG/oz)
Current Price (July 2026): $62.35
Conservative Year-End Forecast: $56 (BofA)
Optimistic Year-End Forecast: $100+ (Citi)
Wall Street Consensus (Average): $81
Primary Demand Driver: Solar Photovoltaics, EV Electronics, and AI Data Center Architecture
Copper (HG/ton)
Current Price (July 2026): $13,700.00
Conservative Year-End Forecast: $13,700 (Goldman Sachs)
Optimistic Year-End Forecast: $15,500 (UBS)
Wall Street Consensus (Average): $14,350
Primary Demand Driver: Global Electrification, Grid Expansion, and AI Compute Infrastructure
Source: Compiled institutional research data from Goldman Sachs, JP Morgan, UBS, Citigroup, BofA, and ING (July 2026). All values are expressed in U.S. dollars.
COPPER: THE "FORGOTTEN METAL" THAT BECAME WALL STREET’S FAVORITE CONVICTION
While gold and silver stumbled under the weight of the Federal Reserve’s restrictive rhetoric, the copper complex delivered a remarkably divergent and defensive performance. Copper maintained resilient technical behavior and notched successive nominal records early in the year, skyrocketing from an average level of $4,200 per metric ton in mid-2025 to historic peaks exceeding $14,500 in Q1 2026. Currently trading around $6.22 per pound on COMEX (the approximate equivalent of $13,700 per metric ton), copper has solidified its status as the highest-conviction structural commodity trade among Wall Street strategists.
The dynamo powering this extraordinary performance transcends financial liquidity cycles and is firmly anchored in global physical infrastructure. The global economy is engaged in a massive, simultaneous macro-process of structural electrification. This phenomenon encompasses not only the replacement of internal combustion engine fleets with electric vehicles (which require up to four times more copper per unit), but more importantly, the overhaul and expansion of thousands of miles of electrical transmission and distribution grids required to integrate utility-scale renewable generation assets (wind and solar) located far from major urban consumption centers.
More recently, an overwhelming new catalyst has emerged: the technological arms race to build out computational infrastructure for Artificial Intelligence. Large language models require hyper-dense data centers whose power and thermal footprints are exponentially larger than those of traditional cloud-computing server farms. Quantitative estimates from JP Morgan indicate that newly constructed global data centers will demand an incremental net addition of nearly 500,000 metric tons of copper by the close of 2026. The technical rationale is straightforward: every gigawatt (GW) of installed capacity in an AI-focused data center consumes tens of thousands of tons of copper across transformers, heavy power busbars, precision grounding systems, structured cabling, and high-performance heat exchangers.
On the supply side, the landscape is defined by structural crisis and chronic rigidity. The global copper extractive industry is facing a perfect storm of operational constraints. Average ore grades across the world's largest deposits, located in Chile (such as Escondida) and Peru, have been in a steep, decade-long decline, requiring the processing of massive volumes of rock to yield the same volume of refined cathode. Furthermore, smelting bottlenecks have become acute. China aggressively expanded its domestic copper metallurgical smelting capacity over recent years, creating structural overcapacity that is now fiercely competing for a capped supply of raw copper concentrate in the spot market. Analytst models estimate a consolidated global copper market deficit of approximately 330,000 metric tons for the full year of 2026.
UBS projects that copper will reach the $14,000 per ton mark by September 2026, scaling to $15,500 by mid-2027. Goldman Sachs, meanwhile, revised its projections to fix a firm year-end target of $13,700, endorsing the thesis that physical tightness will force the market to operate under price-induced demand rationing among non-critical industrial sectors.
TECHNICAL MARKET ANALYSIS AND CAPITAL FLOWS
From a purely quantitative and technical perspective, price action across all three metals at the start of Q3 2026 suggests the formation of a consolidation pattern following a definitive selling climax. The 14-day Relative Strength Index (RSI) for both gold and silver, which had penetrated deep into oversold territory (below 30 points) at the end of June, initiated an upward slope reversal, crossing above its simple moving average and signaling the return of institutional capital inflows.
In the case of gold, prices found major technical support directly on the 200-day Exponential Moving Average (EMA 200), a line that historically acts as the ultimate dividing line between structural bull markets and cyclical bear markets. Respecting this support validates the thesis that the long-term macro trend remains firmly bullish. In the COMEX options market, sharp accumulation activity is visible in call options with strike prices in the $4,500 and $4,800 bands expiring in December 2026, indicating that smart money institutional capital is positioning strategically to capture a year-end rebound.
For silver, implied volatility remains at elevated levels, requiring cautious position sizing. However, total open interest across Asian exchanges, such as the Shanghai Gold Exchange (SGE), registered a major spike precisely during the June price washouts—a classic technical indicator that physical metal is migrating from weak, speculative hands to long-term institutional accumulators in the East. In the copper complex, the forward curve structure displays a persistent state of backwardation, where spot and prompt-delivery prices command a premium over longer-dated futures contracts. This technical anomaly is the clearest signal of immediate physical scarcity within London Metal Exchange (LME) and SHFE warehouses, completely invalidating any hypothesis of a broader demand collapse.
CONCLUSION
A rigorous fundamental and technical scrutiny of the forces shaping the gold, silver, and copper markets in July 2026 clearly demonstrates that the recent price retrenchment does not represent the end of a secular macro bull market. Rather, it represents a severe, healthy, and necessary tactical correction within a broader, long-lasting upward trend. Commodity markets inherently operate in multi-year cycles, and pullbacks of 10% to 30% are historically common to purge speculative excesses and the unhedged leverage of short-term macro funds.
The factors that caused the decline in gold and silver are strictly monetary and cyclical in nature: the hawkish posture of the Federal Reserve under Kevin Warsh, global dollar strength, and escalating real yields. However, these financial vectors are in a direct collision course with physical supply and demand fundamentals in the real economy. Gold remains structurally insulated by the ongoing de-dollarization trend across emerging market central banks. Silver and copper are structurally supported by inescapable physical production deficits and an inelastic demand vector generated by the global energy transition and the revolutionary expansion of Artificial Intelligence infrastructure.
For asset allocators and corporate risk managers, the current environment demands analytical patience and tactical execution. Volatility will remain elevated in the near term, and the FOMC policy deliberations scheduled for late July will serve as the next critical short-term catalyst for price direction. Under a fundamental lens, current price levels offer highly attractive entry points for building and expanding strategic long positions, particularly in copper and silver, where physical shortages are projected to intensify through the 2026–2027 biennium.
BIBLIOGRAPHICAL REFERENCES
BANK OF AMERICA GLOBAL RESEARCH. Global Commodities Strategy: Silver Deficits and Marginal Pressures. Global Research Report, New York, June 2026.
BLOOMBERG INTELLIGENCE. Commodity Dashboard: Metal Complex Dynamics Post-FOMC Re-weighting. Terminal Data Analytics, London, July 2026.
CITIGROUP GLOBAL MARKETS. Metals and Mining: Scenario Analysis for Precious Metals in High-Yield Environments. Corporate and Investment Banking Division, New York, May 2026.
GOLDMAN SACHS COMMODITIES RESEARCH. The Clean Energy Copper Supercycle: Industrial Demand and Smelter Constraints. Goldman Sachs & Co. LLC, New York, June 2026.
ING ECONOMIC AND FINANCIAL ANALYSIS. Gold and Silver Outlook: Navigating the Fed's New Policy Path. Amsterdam, June 2026.
JP MORGAN COMMODITY STRATEGY. AI Infrastructure and the Surging Physical Demand for Industrial Metals: Copper and Silver Forecasts to 2027. Global Research, New York, June 2026.
UBS INVESTMENT BANK. Precious and Base Metals Report: Cyclical Correction vs. Structural Bull Market. Wealth Management & Chief Investment Office, Zurich, July 2026.
WORLD GOLD COUNCIL (WGC). Gold Demand Trends Q2 2026: Central Bank Sovereign Survey and Global Accumulation Patterns. London, July 2026.
Contact
Newsletter
contact@economicfinanceworldwide.com
Fone: +55 54 991220659
© 2026. All rights reserved. https://economicfinanceworldwide.com/privacy-policy