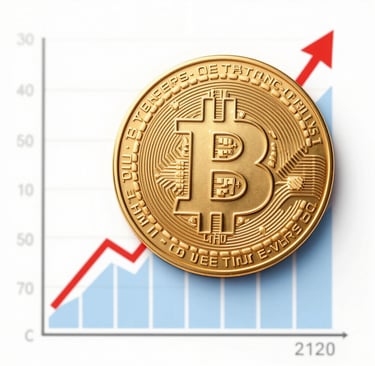
The 2026 Bitcoin Market Cycle: Analyzing Deep Corrections, Institutional Floors, and the Road to Recovery
The future
Salamon, Marcelo
3/27/20267 min read

Executive Summary
This article examines the structural shifts defining the 2026 Bitcoin market cycle, specifically analyzing the mechanics behind its deep corrections. As Bitcoin consolidates its position in a post-$100,000 macroeconomic landscape, the nature of its price pullbacks has fundamentally evolved. By examining the interplay between institutional liquidity cascades, high-leverage derivatives liquidation, and macroeconomic pressure points, this analysis provides investors with a strategic framework to differentiate between secular trend reversals and healthy cyclical capitulations.
Keywords: Bitcoin Capitulation, Market Cycles, Institutional Liquidity, Market Microstructure, Liquidation Cascades.
Introduction
The 2026 digital asset landscape has officially rewritten the rules of cryptocurrency market cycles, breaking away from historical precedents that governed the industry for over a decade. In previous epochs, Bitcoin operated predominantly as an isolated, retail-driven speculative vehicle. This isolation made it prone to prolonged multi-year crypto winters, unmitigated 80% drawdowns, and systemic despair. Today, having firmly established its baseline value in six-figure territory, the asset functions as a mature macro-financial instrument integrated into the global financial plumbing.
However, market maturity has not erased volatility; it has merely altered its fundamental DNA. The current cycle has introduced a sophisticated financial paradox: while the entry of massive institutional capital has created a resilient structural floor, the concurrent growth of highly complex, regulated derivatives markets has concentrated systemic risk.
Consequently, corrections in 2026 materialize with staggering velocity and violence. These drawdowns often mimic catastrophic failures on the charts when they are, in reality, highly calculated structural flushes of over-leveraged market participants. Understanding the precise anatomy of these deep corrections is no longer just an academic exercise—it is an absolute prerequisite for capital preservation and risk management in the modern financial era.
The Structural Evolution of the 2026 Cycle
To properly dissect a modern correction, one must first recognize how the baseline architecture of the Bitcoin market has shifted over the past few years. The historical four-year halving cycle, while still relevant as a psychological anchor and a supply-constriction mechanism, has increasingly integrated with broader global liquidity cycles. The asset no longer moves in a vacuum dictated solely by its internal issuance schedule. Instead, it responds directly to global M2 money supply, sovereign debt rebalancing, and cross-border capital flows.
In 2026, Bitcoin's liquidity pool is split into two distinct, conflicting forces that dictate price discovery:
The Institutional Base This cohort is comprised of spot exchange-traded funds (ETFs), corporate treasuries, sovereign wealth allocations, and multi-asset pension funds. These entities view Bitcoin through the lens of portfolio diversification, actuarial risk mitigation, and a long-term hedge against accelerating fiat debasement. They are historically sticky buyers, bound by strict investment mandates. They react to deep pullbacks not with panic, but with programmatic, algorithmic accumulation—buying the dip via dark pools and TWAP (Time-Weighted Average Price) models to avoid moving the spot market prematurely.
The Derivative Speculators This cohort consists of high-frequency trading (HFT) firms, offshore crypto-native exchanges, and retail traders utilizing extreme leverage via perpetual swaps, futures, and options contracts. Operating on razor-thin margins and ultra-short-term horizons, this segment seeks to maximize alpha during periods of low volatility.
Because the institutional base continuously removes vast quantities of circulating supply from the market via self-custody and cold storage, the remaining "free float" available on liquid exchanges is remarkably small. This supply illiquidity creates a highly sensitive environment.
Historical Risk Note: When speculative traders build massive long positions using 10x to 50x leverage, they create a top-heavy capital structure. Even a minor price drop can trigger a multi-billion-dollar liquidation cascade, causing the price to plunge rapidly despite the fact that the underlying long-term fundamental demand remains completely intact.
The Mechanics of Deep Corrections and Capitulation
Capitulation in 2026 looks vastly different from the grueling, months-long bleeding processes seen in 2014, 2018, or 2022. Modern capitulation is sharp, hyper-compressed, and structural—often running its entire course within a matter of days or even hours. This phenomenon is known among market microstructure analysts as a "systemic liquidity flush."
When Bitcoin undergoes a deep correction in the current environment, it typically follows a rigid, three-stage mechanical process that exploits the plumbing of modern crypto exchanges.
[Phase 1: The Macro Trigger] ➔ [Phase 2: The Liquidation Cascade] ➔ [Phase 3: Institutional Absorption]
Phase 1: The Macro Trigger The correction rarely starts within the crypto ecosystem itself. It is usually initiated by an external macroeconomic shock or a geopolitical flashpoint. In 2026, these triggers have consistently involved escalating tensions in energy corridors, sudden volatility in the oil markets, or unexpected hawkish pivots from the Federal Reserve regarding sticky inflationary data. As traditional risk assets face a localized sell-off, systematic risk-parity trading algorithms automatically trim allocations across all liquid asset classes. Because Bitcoin is highly liquid and trades 24/7, it is often used as an immediate source of liquidity to cover margin calls in legacy financial markets.
Phase 2: The Liquidation Cascade As the initial programmatic selling pushes Bitcoin down by a routine 3% to 5%, the price breaches the stop-loss orders and estimated liquidation prices of over-leveraged long positions in the derivatives market. Once these thresholds are crossed, exchange matching engines automatically seize the collateral and market-sell the underlying asset to close out the leverage debt. This involuntary selling forces the spot price lower, instantly hitting the next tier of leverage. Within hours, a cascading domino effect occurs, detaching the market price entirely from fundamental valuation. It is during this chaotic phase that retail sentiment collapses, panic spreads to unseasoned investors, and forced capitulation peaks.
Phase 3: Institutional Absorption The hallmark of the 2026 cycle is what occurs at the terminal point of these cascades. As soon as the derivatives market is completely cleared of toxic leverage—evidenced by a sharp drop in Open Interest and deeply negative Funding Rates—the institutional bid activates. Spot ETFs, which operate on a T+1 settlement basis, see massive inflows as institutional wealth managers recognize the steep discount. Corporate treasuries and opportunistic buyers step into the liquidity vacuum, aggressively absorbing the undervalued spot supply. This rapid absorption creates a sharp, pronounced "V-shaped" recovery pattern on the daily chart, trapping short-sellers who expected a prolonged bear market.
Macroeconomic and On-Chain Signatures of Exhaustion
Navigating these deep corrections successfully requires transitioning away from emotional narratives and focusing entirely on objective, quantitative data-driven analysis. Market participants must monitor specific macroeconomic and on-chain metrics to accurately identify when a correction has reached structural exhaustion and maximum financial asymmetry.
Realized Price Deviation and MVRV Z-Score The Realized Price—which calculates the value of Bitcoin based on the price at which each coin last moved—acts as the global market's average cost basis line. In the 2026 cycle, the Short-Term Holder Realized Price serves as the definitive support floor for bull markets. When the MVRV Z-Score drops into historical oversold bands during a flush, it signals that the spot price is severely undervalued relative to the actual on-chain capital invested, marking the exact bottom of capitulation.
Funding Rates and Cumulative Volume Delta (CVD) During the panic of Phase 2, perpetual swap Funding Rates frequently plunge into negative territory not seen in months. This demonstrates that remaining traders are paying aggressive premiums to short the market. When this reading coincides with a bullish divergence in the CVD (where spot CVD begins to tick upward while futures CVD continues to cascade downward), it becomes clear that institutions are passively absorbing forced selling via limit orders.
Short-Term Holder Spent Output Profit Ratio (STH-SOPR) The STH-SOPR tracks whether short-term investors are moving their coins at a profit or a loss. Sustained readings below 0.95 indicate that retail traders are capitulating en masse, selling their coins at a steep loss directly into institutional accumulation wallets. Historically, this seller exhaustion provides the exact liquidity vacuum required to reverse local trends and launch the V-shaped recovery.
Key On-Chain and Microstructure Thresholds:
Funding Rates: Highly positive readings (>0.05% per block) indicate a high-risk market top over-saturated with leverage. Conversely, deeply negative readings (<−0.02%) signal a capitulation bottom where leverage has been aggressively cleared and retail short-sellers are forced to pay a premium to maintain their positions.
MVRV Z-Score: Readings above 4.0 historically point to overextended market tops. When the metric drops below 1.0, it marks a cyclical capitulation bottom, reflecting a severe detachment where the current spot price is trading significantly below the aggregate network value.
Open Interest: Reaching all-time high levels builds an unstable environment ripe for a market correction. A sharp, sudden drawdown (>25% within a 24-hour window) confirms a structural liquidation event, meaning the market has successfully flushed out forced volatility and toxic leverage.
Risk Management Strategies for the Modern Investor
Surviving and profiting from the accelerated market dynamics of 2026 requires a total recalibration of traditional investment frameworks. Frameworks that worked when Bitcoin traded below $50,000 have become obsolete or dangerously inefficient.
Elimination of Directional Leverage: In the face of automated liquidation cascades that wipe out billions of dollars in minutes, utilizing directional leverage on the long side has become a mathematical error. Modern investors accumulate via the spot market and utilize derivatives strictly for hedging purposes.
Dynamic Limit Order Laddering: Instead of attempting to time the exact micro-bottom of a cascade, sophisticated allocators ladder buy limit orders below key technical support levels, such as the 100-day and 200-day moving averages. This ensures the automatic capture of forced liquidation equity before Phase 3 institutional absorption takes place.
Active Monitoring of Global Liquidity Indices: Because Bitcoin operates as the ultimate barometer of global liquidity in 2026, tracking Federal Reserve balance sheet contractions, People's Bank of China (PBoC) liquidity injections, and corporate credit spreads is now just as critical as analyzing internal blockchain data.
Conclusion
The 2026 Bitcoin market cycle cements the asset's position as a novel macroeconomic staple. Deep corrections, while intimidating in their velocity and nominal magnitude, no longer represent the existential structural failures or "death spirals" that characterized early market iterations. Instead, they constitute the tax of sophistication—the efficient friction of a hyper-financialized, globalized asset class clearing away short-term excess to build a highly sustainable, institutionalized foundation.
For investors who anchor their actions in quantitative realities and map out the mechanics of the three-phase capitulation process, these drawdowns transform from systemic crises into the highest-asymmetry entry points the modern financial world has to offer. Understanding the migration of supply from forced speculators to institutional vaults remains the defining edge separating the liquidated from the generationally wealthy.
References
GLASSNODE INSIGHTS. The Microstructure of Bitcoin Liquidation Cascades. Quantitative Research Report, 2025.
HAYES, Arthur. Crypto Goes Macro: Global M2 and the Six-Figure Bitcoin Floor. BitMEX Research Series, 2025.
JALIL, Amilcar; WOO, Willy. On-Chain Analysis and Market Efficiency: How Institutional Custody Changes Volatility Metrics. Journal of Digital Asset Finance, vol. 14, no. 2, pp. 112-128, 2025.
SOCIETÉ GÉNÉRALE CRYPTO RESEARCH. Spot ETFs and the Free Float Crunch: Analyzing Liquidity Inelasticity in Digital Assets. Global Markets Report, 2026.
ZHANG, L. & MULLER, K. The Velocity of Leverage: Automated Liquidation Engines and Their Impact on Asset Spot Prices. Financial Innovation Review, vol. 9, pp. 45-61, 2025.
Contact
Newsletter
contact@economicfinanceworldwide.com
Fone: +55 54 991220659
© 2026. All rights reserved. https://economicfinanceworldwide.com/privacy-policy